
Residential solar in City B, Synthetic State B
Use the synthetic City B scenario to see how a different utility rate and roof profile change the math.
Demo figures, utilities, incentives, testimonials, and crews are synthetic illustrations, not verified municipality or business claims.
Start with your average monthly electricity bill.
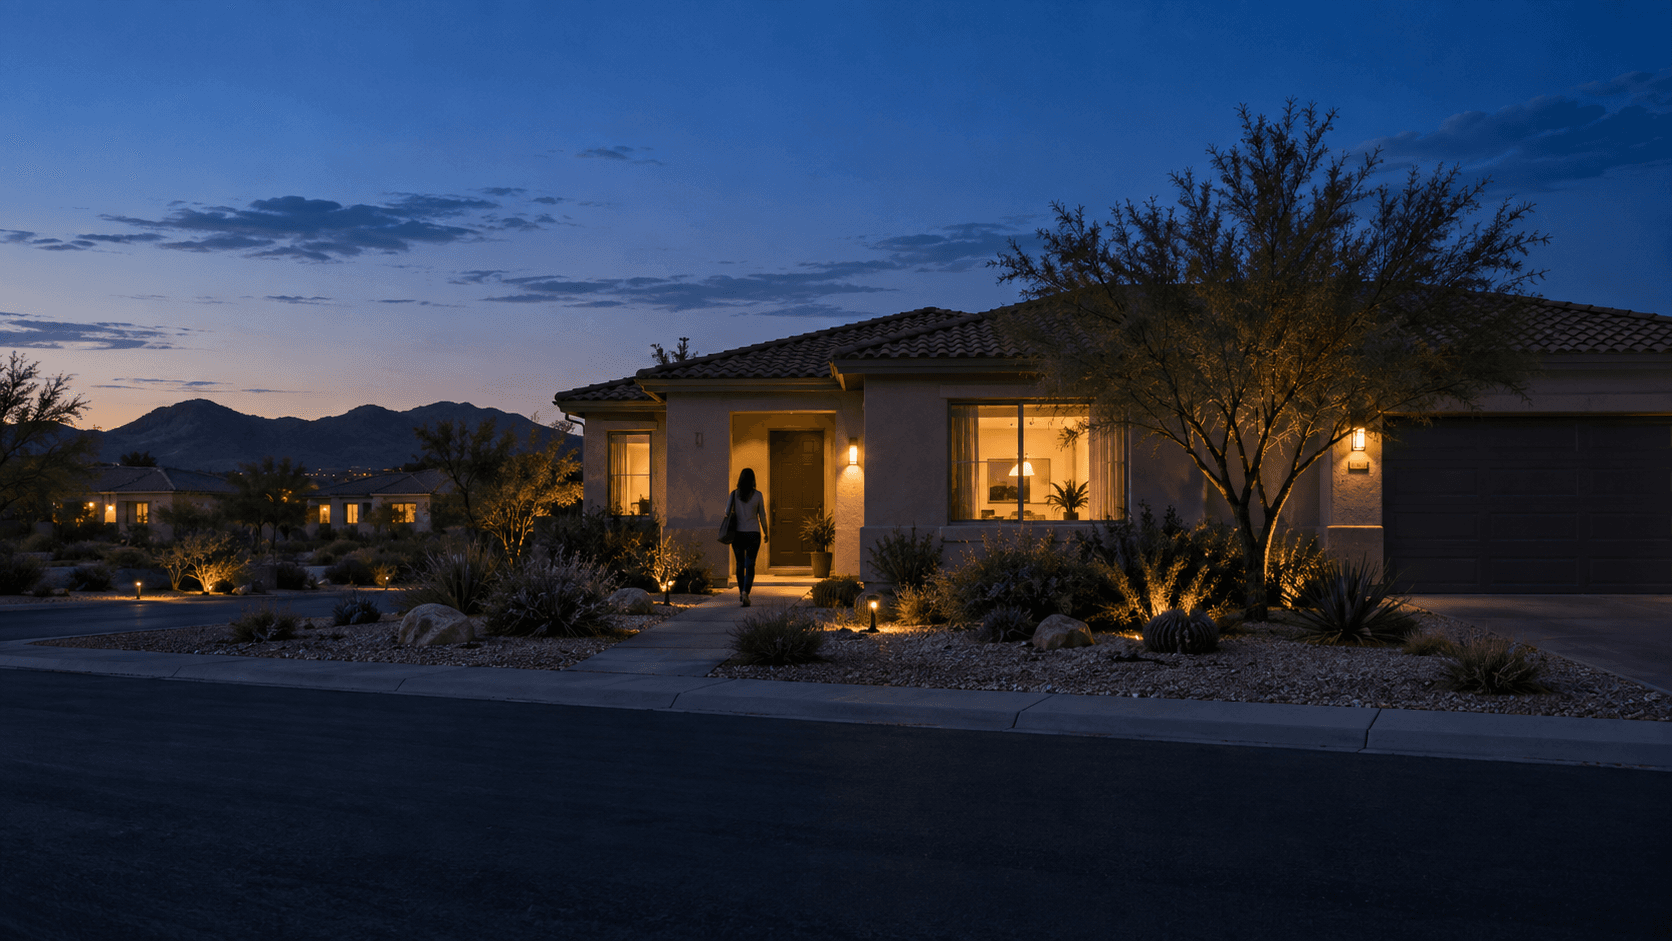
Illustrative home. Roof fit needs an assessment.
A synthetic scenario, step by step
Make the solar math visible
City B uses its own assumptions and copy so this synthetic scenario can be explored on its own terms.
 01
01Start with the bill
Choose a household profile or enter a bill directly. The demonstration makes the starting point explicit before estimating panel output.
 02
02Test the assumptions
Change coverage and compare the illustrative Cedar grid rate, sunlight, panel size, and installation cost.
 03
03Review the handoff
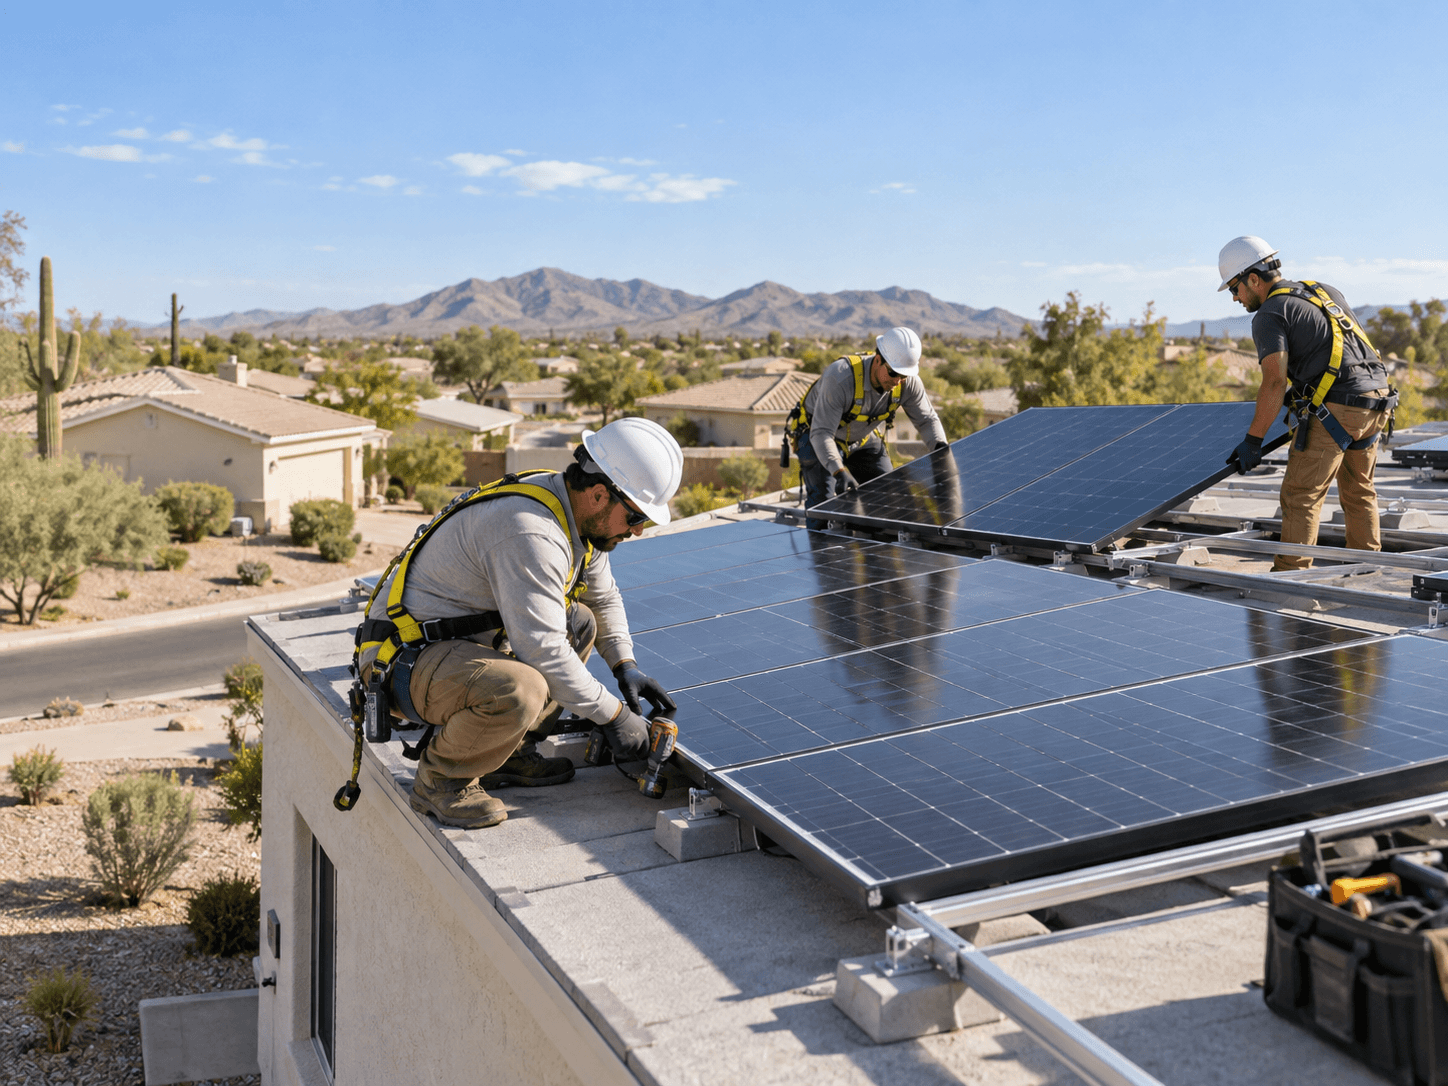
The fictional crews show how a finished installation story can be presented while remaining clearly separate from real claims.
Clear information
Your questions, answered
How many panels does the City B example use?
At a $220 monthly bill and 80% coverage, the synthetic City B assumptions produce 37 panels. This is demonstration data, not a real recommendation.
What assumptions shape the City B panel count?
The synthetic City B count reflects this scenario’s $0.10 utility rate, four peak sun hours, 500-watt panels, and 80% coverage target. It is illustrative, not a real recommendation.
Is Cedar Demonstration Grid a real provider?
No. The utility name, figures, and incentive examples are synthetic illustrations and not verified claims about a municipality or business.
Why are there four crews?
Four explicit fictional crews exercise the data shape used by the social proof section. Their portraits and stories are not real business claims.
Can I use this estimate for a City B installation?
No. City B is a synthetic scenario intended to explain the estimator, not to provide a quote, utility guidance, or installation service.
Try the City B numbers
Open the estimator to compare a different rate, panel size, and coverage target in this synthetic scenario.
Synthetic stories from City B
Explore an illustrative coastal-grid scenario
2 of 3 · Elena V.
Illustrative field teams
Four fictional crews, one clear example
Harbor Line Crew
A fictional team known for careful flashing checks on the windy side of the harbor.
Illustrative image · fictional crew
Cedar Ridge Team
A synthetic crew that keeps a precise installation log for every demonstration home.
Illustrative image · fictional crew
Breakwater Installers
A fictional group focused on panel spacing, roof access, and a tidy final walkthrough.
Illustrative image · fictional crew
Tideglass Crew
A synthetic four-person crew that explains each handoff without promising real service.
Illustrative image · fictional crew